Here is another interactive graph about Tisserand's parameter. My first post about it has the explanation what it is, and also a line graph that adapted to the set orbital parameters semimajor axis a, eccentricity e and inclination i of a perturbed body and the chosen perturber, any giant planet. First, here is the definition again, where Tp is the Tisserand parameter:
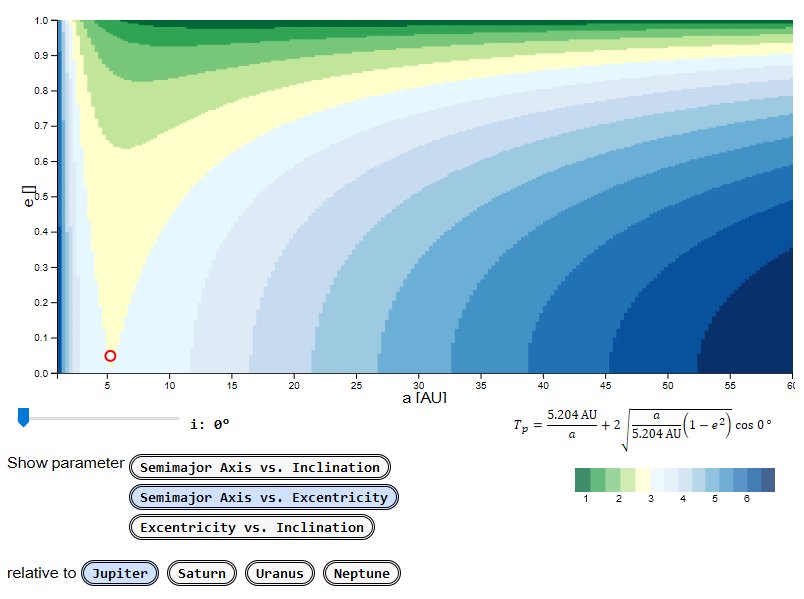
As stated in the above post, the nice thing about it is that it is a quasi-conserved quantity that stays more or less the same before and after a close encounter of an asteroid, a comet or a space probe with a large body. Even nicer would be to see a whole lot of parameter-combinations at once, as a Tp-heat map combining any two parameters in a plane. Like this:
As you can see, the graph lets you select the parameter combination a vs. i, a vs. e, or e vs. i, and chose a value for the third one separtely, for each of the giant outer planets, which are represented by a red circle in the plane. The currently selected parameters are indicated in the resulting formula at the lower right. The Tisserand value below the crosshair is indicated close to it, along with the peri- and aphelion (closest and farthest distance to the Sun) for the given combination of parameters.
So that means paths along the same line of Tisserand values indicate changes of the plotted parameters achievable by a flyby of the respective giant planet, be it for a spacecraft, asteroid or comet. At least that's what I think it means.
The graph uses D3.js for display and interactions, and MathJax for math-formatting. Check out the source code on GitHub
No comments:
Post a Comment